

MBB – Shares
MBB’s share capital is divided into 5,716,392 no-par value bearer shares. The company was floated on the stock market on 9 May 2006 at an issue price of EUR 9.50. The shares have been traded on the Prime Standard segment since 20 June 2008. A high international standard of transparency for the shareholders is guaranteed as a result.
Market information:
| WKN/ISIN | A0ETBQ/DE000A0ETBQ4 |
| Ticker symbol / Reuters code | MBB / MBBG.DE |
| Number of shares | 5,716,392 (average number of share in circulation 2022: 5,735,490) |
| Class of shares | Ordinary bearer shares with no par value (no- par shares) |
| Stock exchanges | XETRA, Frankfurt, Düsseldorf, Berlin, Stuttgart, Munich |
| Free float | 29% |
| Accounting standard | IFRS |
| End of the financial year | 31 December |
| First quotation (Prime Standard) | 20 June 2008 |
| Designated sponsor | ODDO SEYDLER BANK AG |
| Associated indexes | CDAX, Classic All Share, DAXPLUS FAMILY, DAXsector Industrial, Prime All Share |
| Paying Agent | DZ Bank AG, Düsseldorf, Germany |
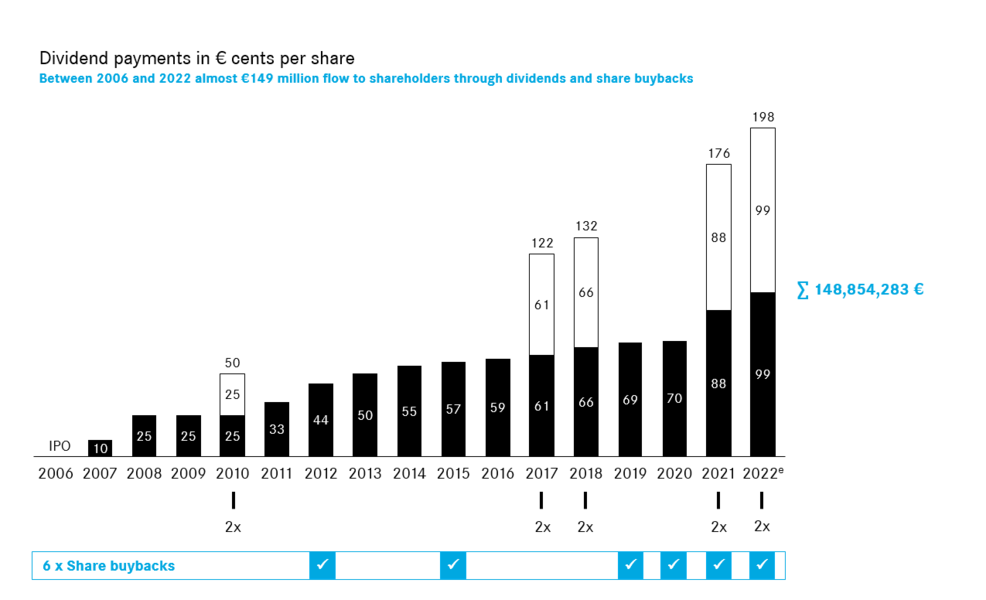
Dividend policy
Since its flotation, MBB has paid a dividend equal to or greater than the previous year’s dividend every year. Special events are taken into account with a special dividend.
Shareholder structure
MBB’s share capital, as of 31. December 2023, is € 5,716,392 and is divided into 5,716,392 no-par value bearer shares, around 69% of which are owned indirectly by the founders of MBB, Dr Christof Nesemeier and Gert-Maria Freimuth.
MBB in figures
Figures in thousands of EUR and margins as percentage of total output, unless otherwise indicated.
| 2023 | 2022 | 2021 | 2020 | 2019 | 2018 | 2017 | 2016 | |
|---|---|---|---|---|---|---|---|---|
| Sales revenues (adj.) | 954,620 | 896,453 | 680,329 | 689,242 | 592,059 | 506,590 | 403,077 | 332,165 |
| EBITDA (adj.) | 80,216 | 93,166 | 79,574 | 85,725 | 67,593 | 54,529 | 38,862 | 30,355 |
| EBITDA margin | 8.4% | 10.3% | 11.7% | 12.5 % | 11.4% | 10.8% | 9.6% | 9.1% |
| EBIT (adj.) | 38,208 | 53,335 | 46,868 | 56,157 | 47,661 | 41,307 | 28,957 | 22,342 |
| EBIT margin | 4.0% | 5.9% | 6.9 % | 8.2 % | 8.0% | 8.2% | 7.2% | 6.7% |
| EBT (adj.) | 39,778 | 49,024 | 40,659 | 49,009 | 37,961 | 39,579 | 27,110 | 20,960 |
| EBT margin | 4.2% | 5.4% | 6.0 % | 7.1 % | 6.4% | 7.8% | 6.7% | 6.3% |
| Consolidated net profit (adj.) | 15,029 | 16,766 | 11,691 | 21,726 | 17,929 | 16,142 | 13,560 | 14,253 |
| EPS (adj.) in EUR * | 2.62 | 2.88 | 1.98 | 3.66 | 2.95 | 2.45 | 2.06 | 2.16 |
| Dividend payment in thousands of EUR** | 5,716 | 11,492 | 10,441 | 4,153 | 4,099 | 4,347 | 8,036 | 3,886 |
| Dividend payment per share in EUR | 1.00 | 1.98 | 1.76 | 0.70 | 0.69 | 1.32 | 1.22 | 0.59 |
| Number of shares | 5,716,392 | 5,814,059 | 5,911,913 | 5,940,751 | 5,940,751 | 6,600,000 | 6,600,000 | 6,600,000 |
| 2023 | 2022 | 2021 | 2020 | 2019 | 2018 | 2017 | 2016 | |
| Total assets | 1,149,020 | 1,121,527 | 1,152,320 | 802,667 | 844,692 | 725,657 | 611,229 | 266,473 |
| Non-current assets | 396,366 | 359,831 | 125,447 | 369,747 | 346,084 | 217,487 | 190,229 | 112,267 |
| Current assets | 752,655 | 761,697 | 218,394 | 432,920 | 498,608 | 508,170 | 421,000 | 154,206 |
| Of which are cash and cash equivalents *** | 529,635 | 512,978 | 622,503 | 330,165 | 340,193 | 376,204 | 279,213 | 77,450 |
| Total equity | 763,908 | 769,527 | 808,479 | 499,692 | 474,552 | 499,292 | 385,057 | 98,399 |
| Non-current liabilities | 102,662 | 105,454 | 125,447 | 121,001 | 149,919 | 78,132 | 86,589 | 69,889 |
| Current liabilities | 282,450 | 246,546 | 218,394 | 181,974 | 220,221 | 148,233 | 139,583 | 98,185 |
| Net cash *** | 475,293 | 445,204 | 534,563 | 252,567 | 249,838 | 312,325 | 222,026 | 22,158 |
| Employee headcount | 3,782 | 3,571 | 3,541 | 3,457 | 3,505 | 2,184 | 2,006 | 1,477 |
* Based on the average number of shares outstanding for the respective year.
** 2018: based on 5,940,751 no-par shares
*** This figures include physical gold stocks